ACCDIS researchers developed a platform that allows for the geographical surveillance of COVID-19 and other diseases for free
A group of scientists from the University of Chile and Sao Paulo, Brazil, developed a free platform that allows for the geographical surveillance of COVID-19 and other diseases, using various features or data to identify areas where there is the highest incidence. It is a website that can be used by any type of public, no need for prior computational or system knowledge.
The pandemic has now reached more than 12 million confirmed cases in 188 countries around the world and more than 500,000 deaths. Unfortunately, Chile does not escape this reality and according to the report Johns Hopkins, to date more than 300 thousand infected. Although the efforts of government agencies have been broad, there's still a battle to be fought.
That's why, that scientists in various areas are constantly fighting time and joining their efforts with the challenge of combining the needs and particularities of each pandemic scenario. "Surveillance is key to controlling epidemics and disease, In addition, at a point where it is essential to have multiple elements that contribute to the mapping and anticipation of the virus, these tools need to be available to everyone", pointed out Vinicius Maracaja, researcher at the Centre for advanced chronic diseases (ACCDIS) and professor at the Faculty of Chemical and Pharmaceutical Sciences at the University of Chile.
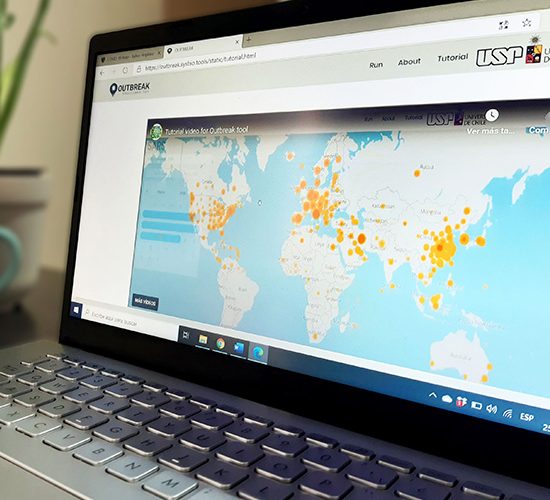
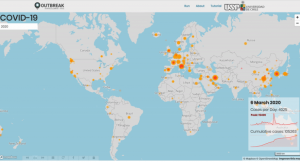
With the collaboration of international researchers from the University of Sao Pablo, Brazil and the group of scientists at the University of Chile, a free digital platform was developed that makes it easy to trace, the number and location of confirmed COVID-19 cases. "This tool allows for geographic surveillance, using various features or data, to be able to identify those areas where there is the highest incidence of disease," explained Vinicius, project leader.
One of the big differences of this platform, called Outbreak and in English "Outbreak" is that it is not only useful for tracking COVID-19 but also, other diseases can be traced over time, everything will depend on the data and information that is delivered to the system, which in turn are removed from the web in the course of a week.
 In this line, ACCDiS postdoctoral researcher Raul Arias, principal author of the study added, "our goal is to give any type of user the option to upload multiple data that contains a geographic location and a date, identifying it by colors, making the interpretation of the results obtained more understandable. This allows the tool to be used not only for disease surveillance, but it can also be used to visualize animal migration, location of accurate data within a municipality such as theft or breaches, among other aspects," Arias said.
High resolution is another important skills of the system, through the platform it is possible to identify outbreak zones as streets, neighborhoods and even houses where there is a higher incidence of a disease, helping governments in the geo-mapping of cases.
On the other hand, the researcher commented that web-based surveillance panels currently run on proprietary platforms or that usually require prior computational knowledge, "unlike them, this tool allows epidemiologists, government agencies or groups of researchers to enter the data more conveniently and track the outbreak in real time. It is certainly a system that can help in making public policy decisions to control a disease", pointed out the scientist.
To see how the platform works Outbreak enters: https://outbreak.sysbio.tools/static/tutorial.html